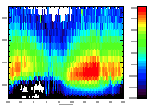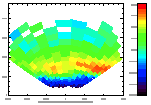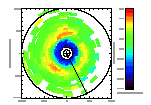
The Sondrestrom Incoherent Scatter Radar can use various combinations of transmitted pulse schemes and antenna motion or dwells to measure the basic ionospheric parameters with different degrees of temporal and spatial resolution. Depending on the antenna mode, some electrodynamic parameters can also be determined. Shown below are some data samples, grouped by different antenna and transmitter modes.
• Electron density (010917-18-ne.pdf) • Electron temperature (010917-18-te.pdf) • Ion temperature (010917-18-ti.pdf) The data from the positions are combined to determine the electrodynamic parameters. • Resolved velocity (010917-18-vr.pdf) • E field (010917-18-ecw.pdf) The higher-resolution alternating code data provide good E region measurements. • Electron density (010917-18-ne-3km.pdf) • Electron temperature (010917-18-te-3km.pdf) • Ion temperature (010917-18-ti-3km.pdf) As can be seen in both the longpulse and alternating code data, the lack of sunlit E region or auroral precipitation is apparent from 22 to 05 UT. From a similar mode, the longpulse line-of-site ion velocity data from the antenna position up B can be used to determine V parallel. From these basic measurements, other parameters such as conductivity, currents, and Joule heating can be derived. BACK TO TOP
• Electron density (010124-1559.pdf) A series of elevation scans can be used to determine the morphology of the F region over time. Plotting Ne, Te and Ti at the altitude slice of 450-km is shown here. The radar's migration under the Tongue of Ionization is apparent, as is the expected anti-correlation of Ne and Te in the F region. • Electron density (011107-1245-1830-ne-450km.pdf) • Electron temperature (011107-1245-1830-te-450km.pdf) • Ion temperature (011107-1245-1830-ti-450km.pdf) When composite scans (similar to el-scans but tipped to the east or west of overhead) are used, those data can be combined to compute the F-region ion convection versus latitude. These comp-scans were interleaved with the el-scans shown above, and one can see the latitudinal distribution of the ion velocity. • Resolved velocity (011107-1245-1830-vr-binned.pdf) BACK TO TOP
The radar antenna can also scan in azimuth while remaining at a fixed elevation. The basic ionospheric parameters (Ne, Te, Ti, and Vi) can be measured in the cone over the site, as shown here for an az-scan at 30 degrees elevation, beginning at the magnetic south and moving CCW for 360 degrees. • Electron density (010124-1554.pdf) There are other transmitter pulse schemes and antenna modes, and we are happy to help you design an experiment to suit your scientific goals, or to help you interpret data already taken. BACK TO TOP |
|||||||||


