The scientific purpose of the measurements determines the radar operating mode. Different transmitted pulse schemes are used, depending on the need for range resolution, signal strength, time resolution, and frequency resolution. The rapid steering capability of the antenna allows for measurements as a function of not just range, but also latitude and local time.
Because of the many data-taking options, there are many ways to display the data. Following are a few examples.
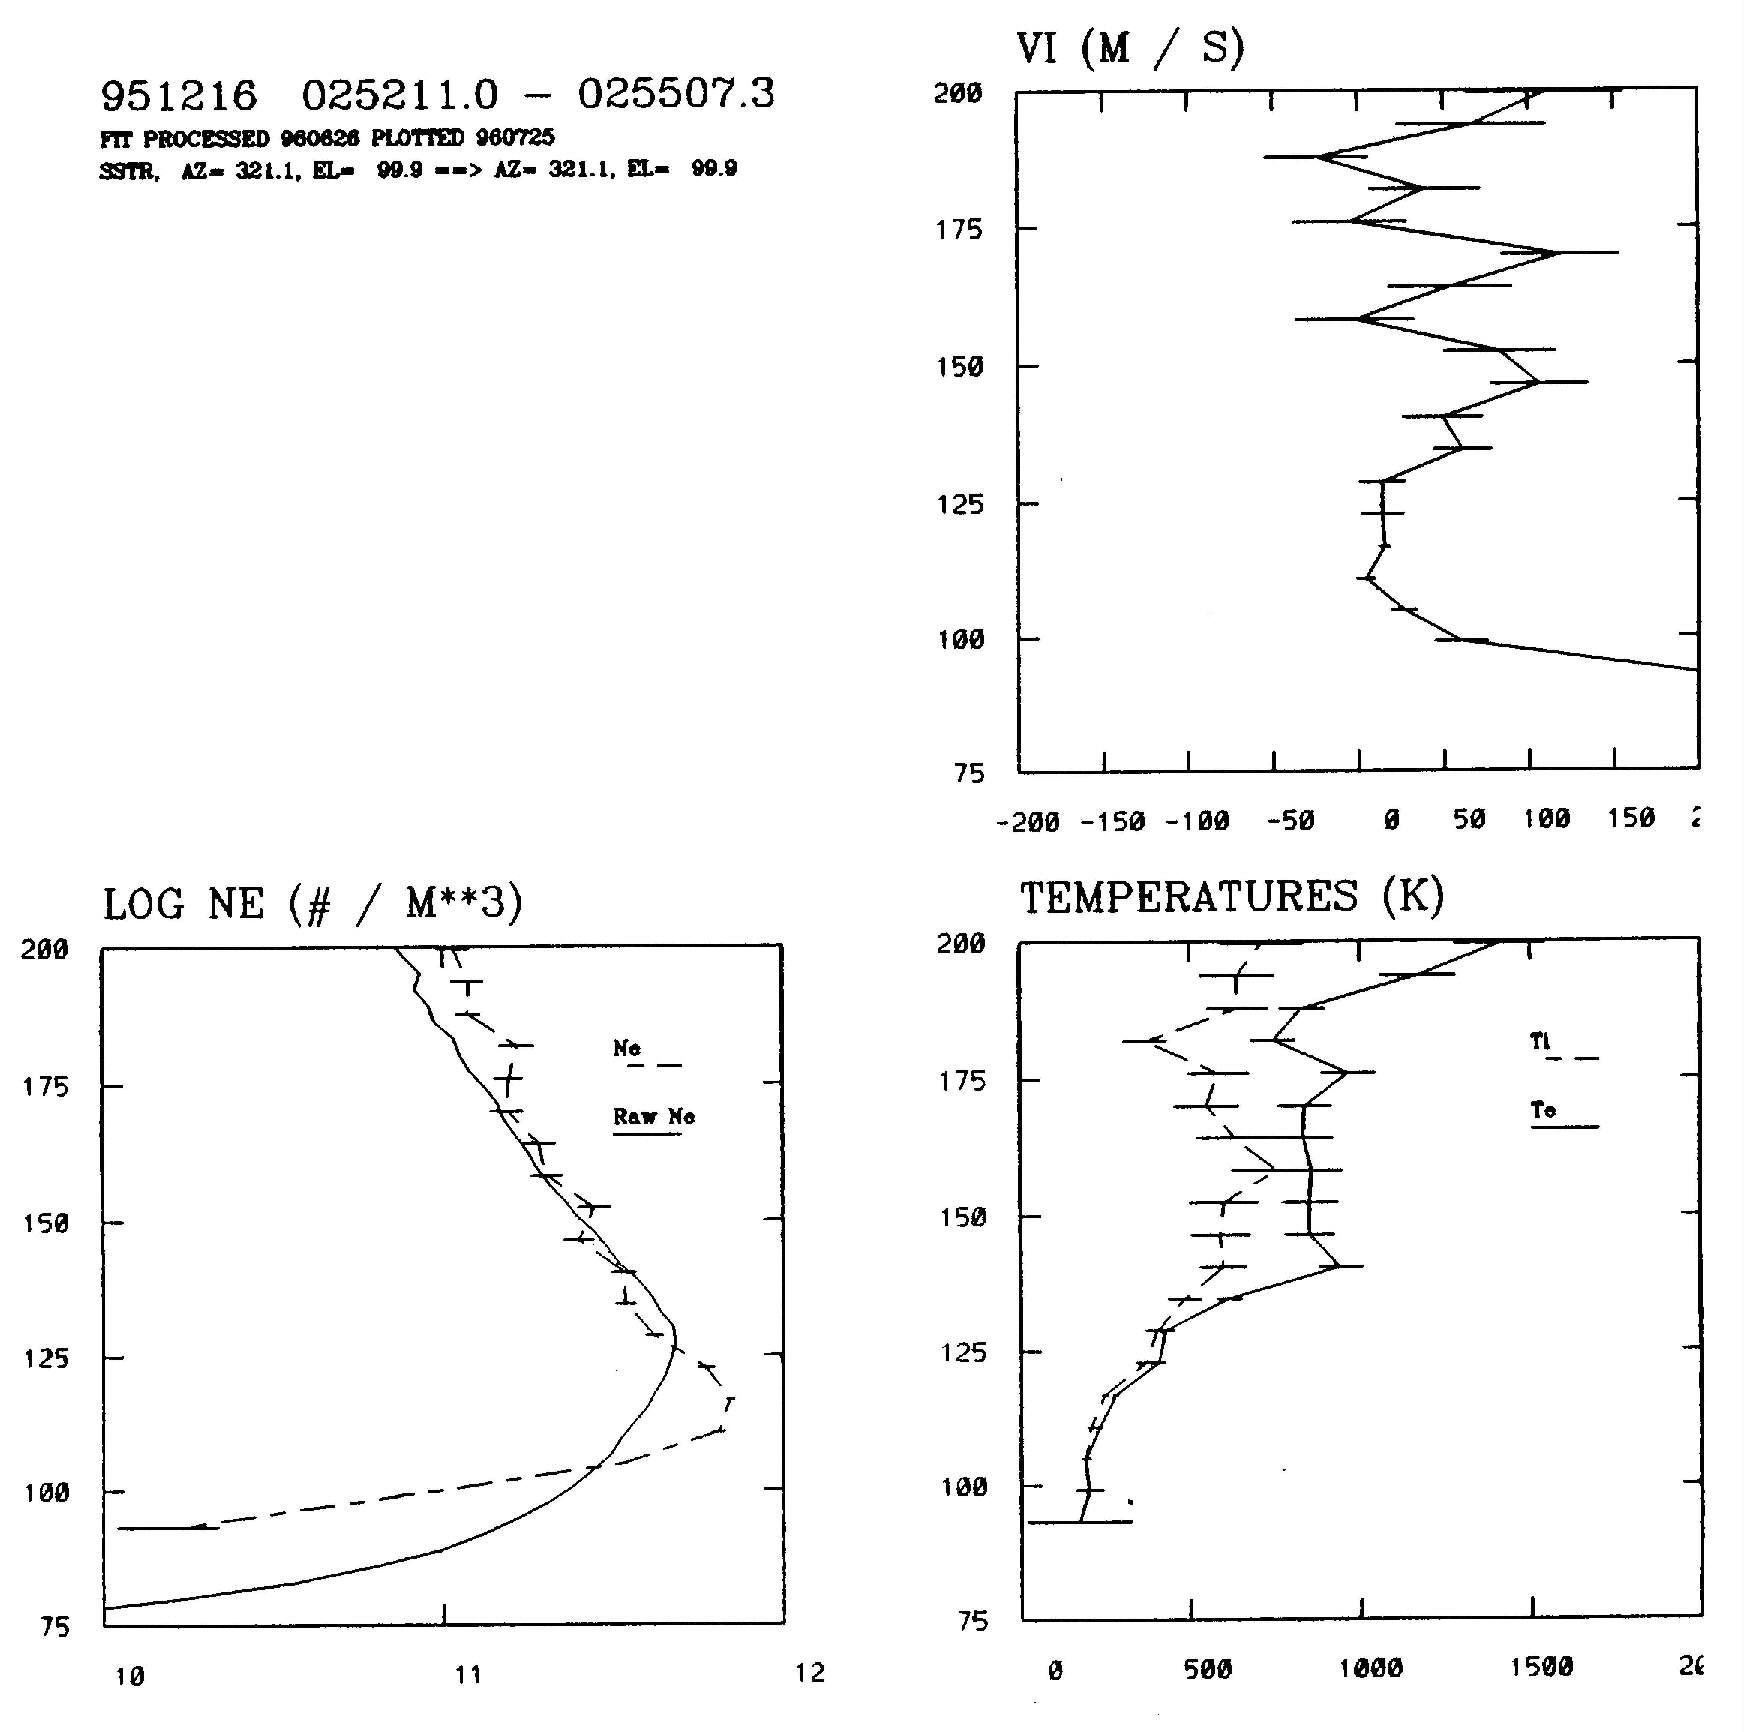
Figure 1 (150 Kb)
This figure shows the radar data from a single 3 minute integration with the antenna pointing parallel to the local magnetic field. Some of the basic parameters derived from radar returns are electron density (NE), ion velocity (VI), and electron and ion temperatures (TE and TI). All of these quantities are obtained as a function of distance along the radar beam. Because this experiment was studying the E-region (where plasma parameters vary relatively rapidly with position), the pulse pattern used has 3 km range resolution.

Figure 2 (297 Kb)
This figure shows the variation of electron density as a function of altitude and time for a two hour period in March of 1992. Because of the large scale heights in the F-region, a 48 km pulse was used. This provided greater signal strength and higher time resolution.

Figure 3 (226 Kb)
This clockdial plot displays the variations in electron density as a function of latitude and time for a fixed altitude (300 km) over a 24 hour period in May of 1996. This experiment took advantage of the steering capability of the antenna and made measurements as a function of latitude. The radar sits under the doughnut-shaped band of data at 74° invariant latitude. The data are displayed north and south of the radar as the site rotates with the earth.

Figure 4 (326 Kb)
This figure displays ion drift velocities from the same time period as figure 3.