The following figures were created with an interactive display program called the Sondrestrom Radar Visualization Tool (SRVT). The SRVT is written in IDL and will run on Unix, PC, and MacIntosh platforms capable of displaying eight-bit color images no smaller than 680 by 530 PIXELS. At least 16 Mbytes of RAM are also required. A short ASCII description is available as well as a PostScript users manual. Various versions of the code can be obtained via anonymous ftp to 128.18.44.72, in the directory pub/radar_vistool:
SRVT40.tar.Z (Unix compressed tar file)
SRVT40.exe (self-extracting pkzip used)
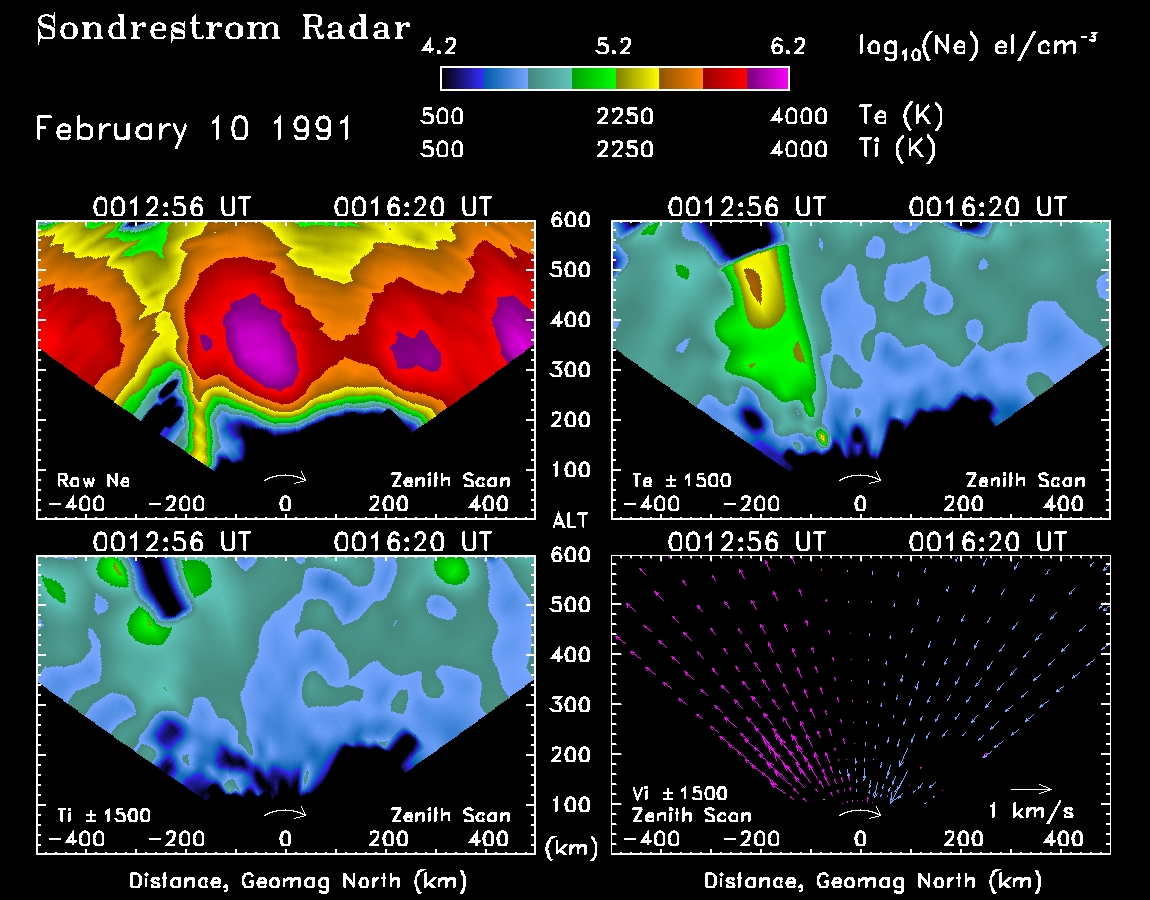
Figure 1 (605 Kb)
Typical display of data from a 120° elevation scan in the plane of the magnetic meridian. The vertical axis shows altitude from ground level to 600 km and the horizontal axis shows 1000 km of ground range from the south (at the left of the image) to the north (at the right of the image). From left to right and top to bottom this figure shows color- coded electron density, electron temperature, ion temperature and line-of-sight ion velocity.
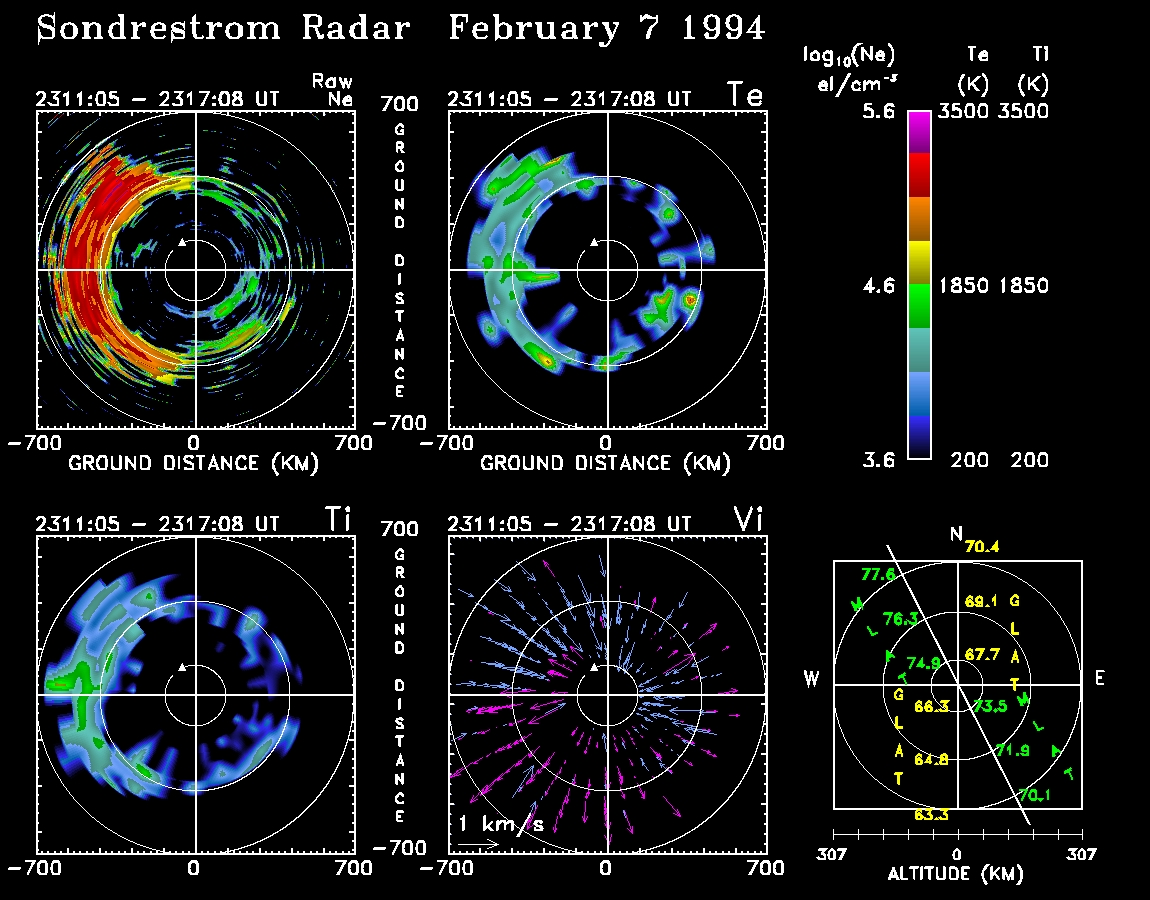
Figure 2 (606 Kb)
This figure shows a horizontal projection of a 360° azimuth scan in the evening sector. This scan, obtained at an elevation of 30°, is displayed here to a distance of 375 km from the radar. Individual panels are oriented with geographic north at the top and with geographic east clockwise from north. A reference grid showing the relationship between geographic latitude, geomagnetic latitude, and altitude is shown to the lower right. The four data panels show electron density, electron temperature, ion temperature, and line-of-sight ion velocity.
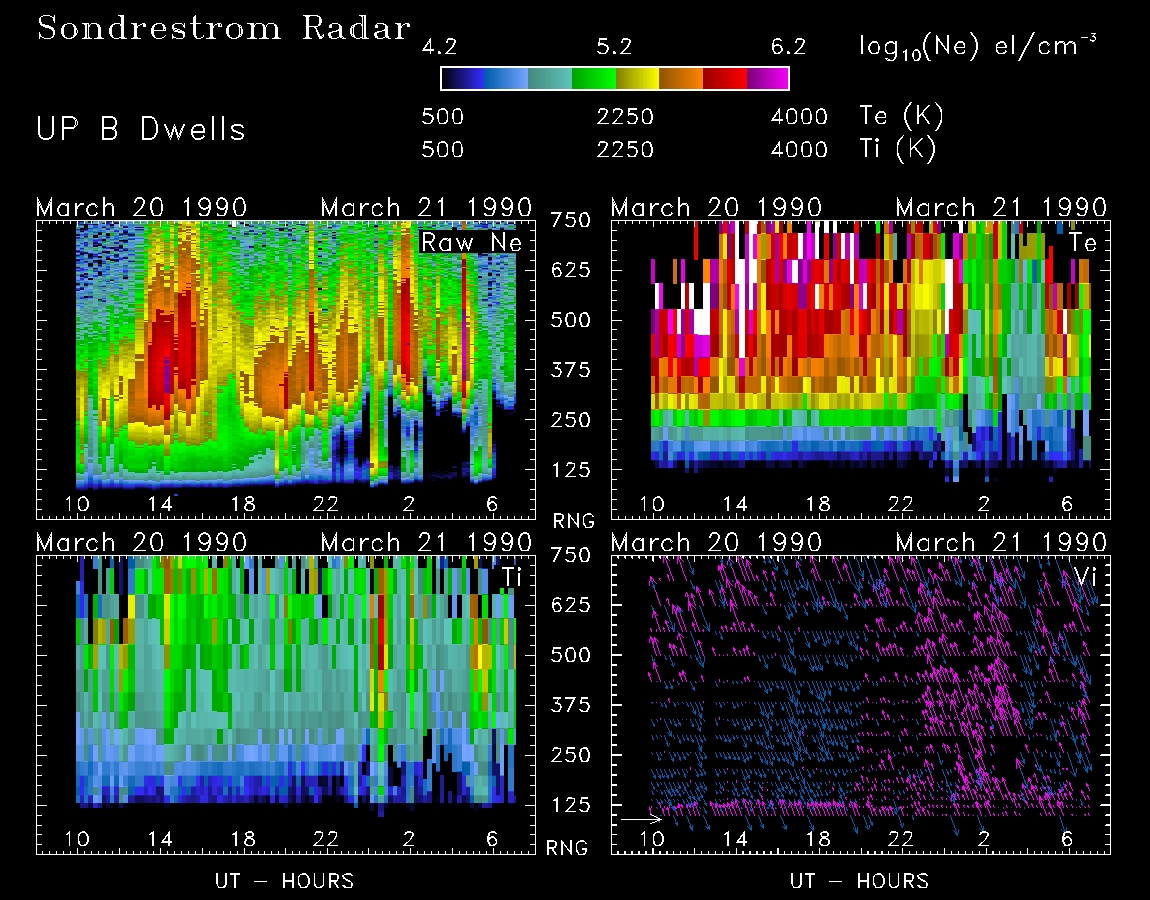
Figure 3 (761 Kb)
This figure shows 23 hours of dwell data during the great geomagnetic storm of March 20, 1990. The horizontal axis indicates time in UT from March 20 to March 21, 1990, and the vertical axis indicates altitude. These data were collected looking up the local magnetic field line. The four data panels show electron density, electron temperature, ion temperature, and line-of-sight ion velocity.