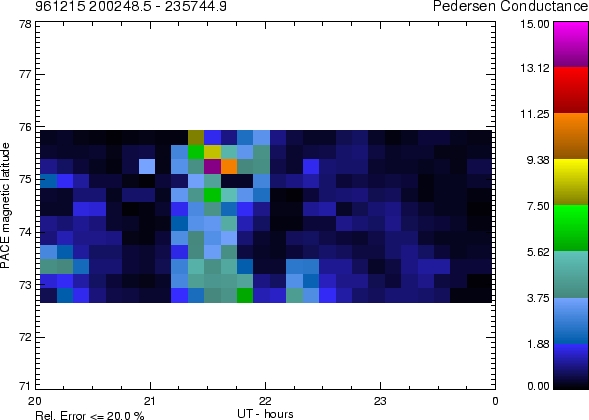
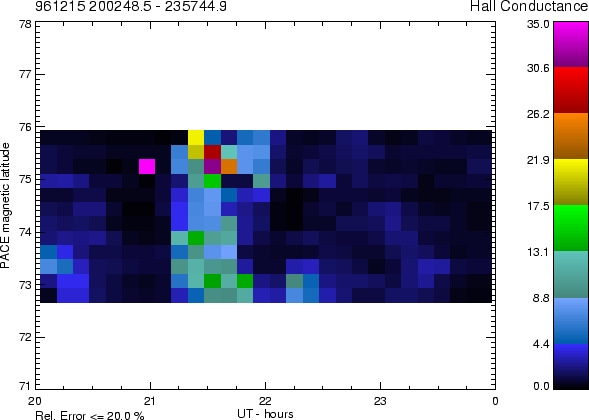
Latitudinal distribution of Pedersen and Hall conductance versus time is shown on the right hand side column.
This is a period with several well defined onsets that started well westward of midnight during a long interval of weak southward IMF.
Mpeg movies (one for LBHL emission, another for LBHS emission) of the auroral evolution observed by POLAR UVI shows the expansion onset at 20:52 UT. The initial auroral intensification region had a longitudinal size of 2.5 hours MLT and was centered at 21:30 MLT. (Mpegs created at JHU/APL by K. Liou.)
Western Greenland was just westward of the intensification when it started
but it was embedded in it shortly afterward.
An mpeg of the key parameter UVI measurements shows the geographic
location of the intensification (mpeg generated by CDAWEB).
The initial
intensification started in the local time sector between Greenland
and Scandinavia.
GEOTAIL EPIC (D. Williams, A. T. Y. Lui) observed onset of tailward flows in the pre-midnight region (Xgsm=-23, Ygsm=6.3, Zgsm=-1.4 Re) at 2154 UT. These flows had the bipolar signature expected from plasmoid ejection. Tailward flow was followed by succesive earthward flows and dipolarizations (S. Kokubun) starting at 2132 UT. The tailward and earthward flow characteristics can be seen in the LEP moment calculations (T. Mukai).
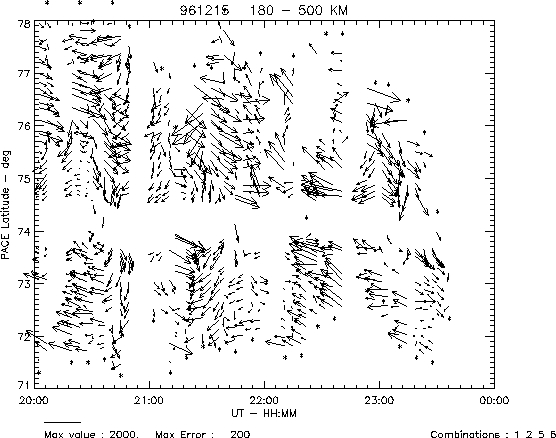
There were clear signs of enhanced equatorward convection starting at
~2020 UT. The enhanced convection front propagates in the equatorward direction
and reaches a maximum penetration at ~2040 UT. This represents a signature
of enhanced reconnection since the plasma is crossing the polar cap boundary,
located at 75.5 MLAT, as shown by the Pedersen conductance map below. Further
enhanced equatorward convection was measured at 2120 UT.
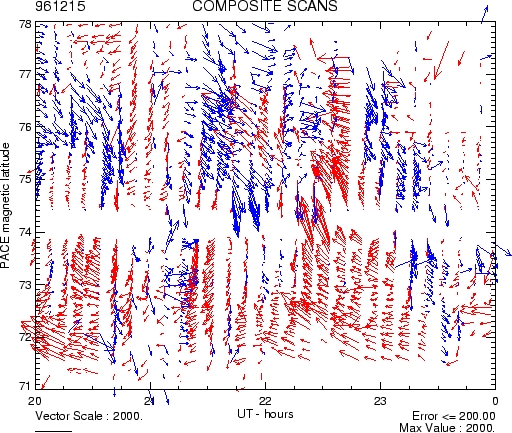
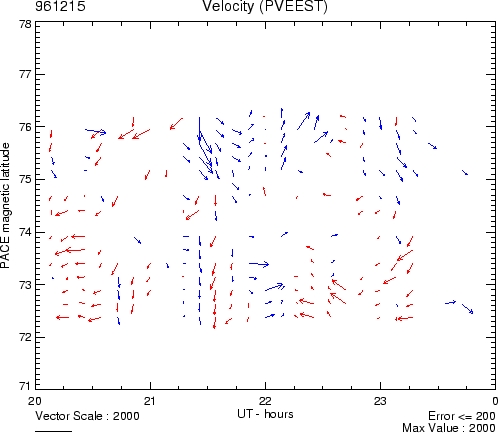
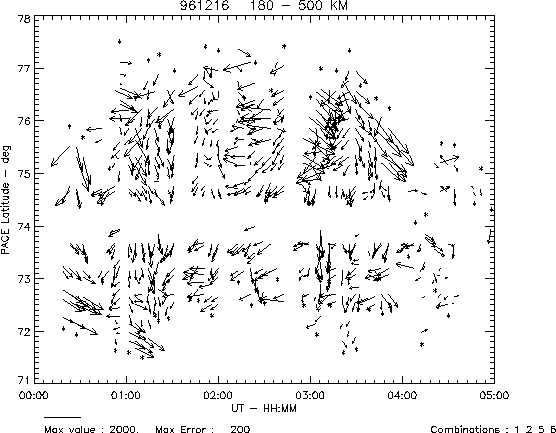
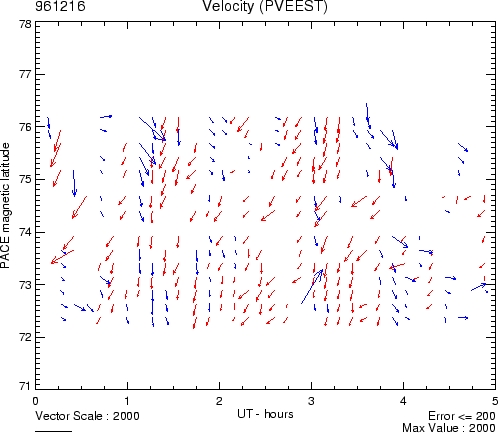
Convection vectors obtained from two different methods are shown below.
One method (composite scans) combines line-of-sight velocity measurements
to resolve vectors, the other (pveest) infers vectors from single scans.
The methods are described in the main page.
|
|
|
|
|
The three panels on the left column shows ionospheric
convection measurements from three methods. From top to bottom, the methods
are, respectively, combination of elevation scans and composite scans,
combination of composite scans and, elevation scans. The methods are described
in the main page.
Latitudinal distribution of Pedersen and Hall conductance versus time is shown on the right hand side column. |
 |
 |