High Latitude Ionospheric Impact of the January 1997 Coronal Mass Ejection |
On January 6-7, 1997, scientists from NASA's ISTP (International Solar Terrestrial Physics) program observed a large coronal mass ejection (CME). The matter from this event and the associated disturbances in the interplanetary magnetic field propagated in the solar wind to the earth several days later and continued through the magnetosphere and into the earth's ionosphere. This page presents ground based measurements of ionospheric activity associated with the coronal mass ejection. All data on this page were taken with the Sondrestrom incoherent scatter radar and the Sondrestrom allsky imager. For a comprehensive survey of data from all NASA instruments that observed this event, see http://www-istp.gsfc.nasa.gov/istp/cloud_jan97/event.html.
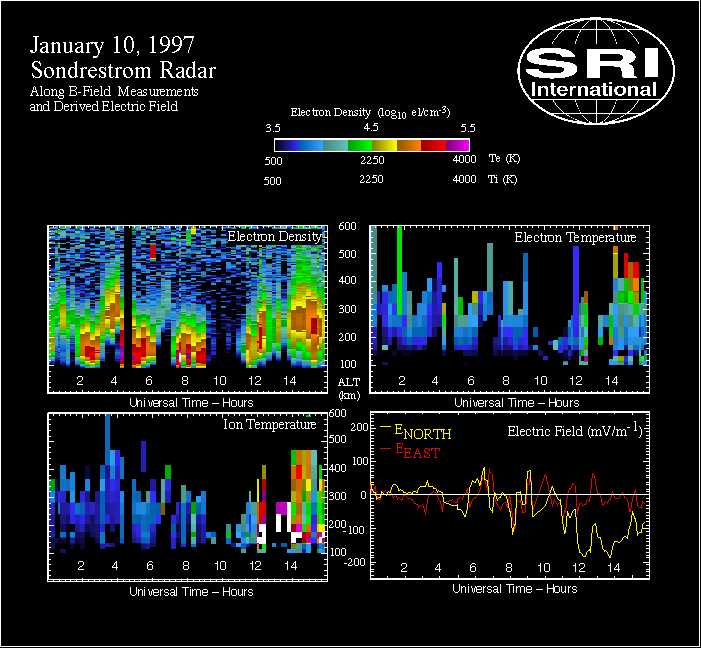
The radar data presented below are the result of a preliminary analysis. They were derived using standard processing procedures that assume isotropic Maxwellian velocity distributions. These assumptions may not be valid during periods of high electric fields shown in the data. An analysis that estimates the effects of non-Maxwellian velocity distributions is currently in progress.
Three plots presenting data from the radar and movies of allsky imager data in quicktime format are presented below
The following shows the electron density as a function of altitude and time as measured with the Sondrestrom Radar in Kangerlussuaq, Greenland.
Preliminary interpretation
Preliminary interpretation
The following QuickTime video files include sequences of Sondrestrom Allsky images of auroral activity as recorded in 630.0 nm "red-line" emission on 09-10 Jan 1997 following the detection of a solar coronal mass ejection event by the SOHO and WIND satellites. The images are oriented such that the top pixel of the central column in each frame is at 5 degrees geographic azimuth. These images are presented in the normal allsky orientation with East counterclockwise from North. The magnetic meridian, therefore, is at the 2 O'clock position. The time on each image is in UT.
**To view these files, your browser must support QuickTime video.
 |
21:08UT 09 Jan to 11:38UT 10 Jan : Entire night's Allsky data : 8.4 megabyte QuickTime video file with a JPEG codec |
 |
00:58UT to 05:58UT 10 Jan : 5-hour period following the arrival of the solar wind shock, the IMF fluctuations and the magnetic cloud associated with the coronal mass ejection : 2.2 megabyte QuickTime video file with a JPEG codec |
 |
05:59UT to 09:59UT 10 Jan : 4 hours during a period of extraordinary ionospheric Joule heating associated with the main phase of the storm produced by the solar coronal mass ejection : 1.6 megabyte QuickTime video file with a JPEG codec |